The Shake and Bake Dashboard
A few weeks ago, someone asked me if it is possible to create a server dashboard (real time processor usage, available memory etc.) using web technologies. Quickly thinking about it, I thought “sure” how hard could it be, but there are several pieces needed to make it functional and meaningful.
- A way to send the data to clients. (You could have each page poll a web server over and over, but that creates a lot of overhead for little benefit.)
- A way to retrieve the server data on at regular intervals.
- A way to meaningfully present the data.
Transmitting Data to the Client
A short time ago, Microsoft released SignalR 2.0 and made it incredibly easy to install and use in projects. It is a method of using WebSockets to create a single open TCP connection to frequently transmit data between the browser and the server. Browsers can send data without opening a new HTTP request, and servers can push new data to the client when needed. It’s fast, efficient and removes the requirement for the client to continuously poll for updates.
The documentation and tutorials are easy to follow and walk you through the process of setting up a test project to teach the basics. The only issue I found with installing it in my own project was making sure the JQuery bundle referenced in the _Layout.cshtml was moved to execute before the RenderBody method.
Polling Data
ASP.NET code is typically an on demand only process. A client must get or post data to the server in order for the server side code to execute. Once the request ends, the objects in that process are disposed/readied to be garbage collected and makes having an in memory object which makes updates at regular intervals problematic. There are ways around this, such as having a process ping the web server at regular intervals, but this made it more complicated than I wanted as I would have to create another application to communicate to the web server to trigger the update actions.
While searching for a solution, I discovered IRegisteredObject which allows you to use the HostingEnvironment.RegisterObject to keep an object in web application’s memory. After that I created a Timer object to gather information about the current process and send it through SignalR on regular intervals.
public void Start()
{
  HostingEnvironment.RegisterObject(this);

  _timer = new Timer(OnTimerElapsed, null,
  TimeSpan.FromSeconds(1), TimeSpan.FromSeconds(1));
}

private void OnTimerElapsed(object sender)
{
  var number = ProcessorMonitor.GetProcessorMonitor().ProcessorUsage;
  ProcessorHub.SendProcessorUpdate(number);
}
Displaying Data
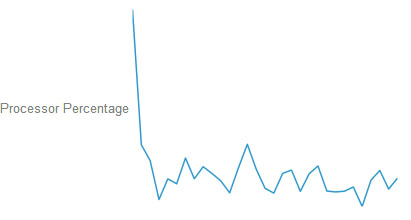
Displaying the chart was the easiest part of the process. Google has an excellent charting module in JavaScript. It’s powerful, easy to use, and fast which I needed to quickly refresh the graph when new data came from the server.
Getting the module from Google is extremely easy. Add the following tag to the page:
<script type="text/javascript" src="https://www.google.com/jsapi"></script>
To create a basic sparkline that refreshes from a SignalR update only took the following code to allow the graphing to start as soon as the paged finished loading:
google.load("visualization", "1", { packages: ["imagesparkline"] });

$(function () {
  var dataItems = [['Processor Percentage']];

    var drawChart = function () {

      var data = google.visualization.arrayToDataTable(dataItems);

      var chart = new google.visualization.ImageSparkLine(
        document.getElementById('chart_div')
      );

      chart.draw(data,
        {
          width: 400, height: 200, showAxisLines: false,
          showValueLabels: false, labelPosition: 'left'
        }
    );
  }

  var processorNotification = $.connection.processorHub;
  $.connection.hub.logging = true;

  processorNotification.client.broadcastProcessorStats = function (percentage) {
    dataItems.push([percentage]);
    drawChart();
  };

  $.connection.hub.start();

    });
All the code for the project can be found here.